

.png)
If you've ever tackled the analysis of open-ended survey responses, you know it's not straightforward. These responses are invaluable because they provide a deeper, richer understanding of your customers, employees, or prospects than simple yes/no or scaled responses.
Open-ended questions invite respondents to share their thoughts in their own words. They offer a more detailed and personal view of their experiences and perceptions.
However, analyzing this qualitative data can be demanding, even for seasoned market researchers. In this guide, we'll walk you through a practical, step-by-step process on how to analyze open-ended survey responses.
For example, in UX research, understanding user sentiment helps refine products to meet user needs and expectations better.
How to analyze open-ended survey responses?
There are different ways to analyze survey responses, from manual methods to AI-powered survey analysis. Here's a simple approach:
- Clean your data: Start by organizing your responses in a spreadsheet. Remove duplicate entries, fix formatting issues, and delete any irrelevant or spam responses. Make sure all text is readable and properly formatted.
- Read-through responses: Take time to read through your responses without taking notes. This first pass helps you understand what people are saying and spot apparent patterns. Pay attention to common complaints, praise, or suggestions that keep coming up.
- Create themes: Start grouping similar responses together. For example, if many people mention "slow loading times" or "confusing navigation," these become your themes. Don't worry about getting it perfect - themes can be adjusted as you go.
- Tag your responses: Go through each response and tag it with relevant themes. One response might fit multiple themes - that's okay. Keep track of how many responses fit each theme to understand what issues are most common.
- Find valuable quotes: While tagging, save standout quotes that clearly illustrate each theme. These specific examples will help bring your data to life when sharing findings with others.
- Choose your tool: Pick a tool that matches your needs:
- Small survey (under 100 responses): Excel is fine
- Medium survey (100-1000 responses): Try Looppanel or similar AI tools
- Quick overview needed: ChatGPT can help spot initial patterns
- Share insights: Don't just present numbers - tell the story your data reveals. Focus on surprising findings and clear patterns. Always include specific examples and quotes to support your conclusions.
4 essential tools to analyze open-ended survey responses
In the world of user research and customer feedback, analyzing open-ended survey responses can be both insightful and challenging. Here's a comprehensive guide to four powerful tools that can help you make sense of qualitative data efficiently and effectively.
1. Looppanel: AI-powered Research Analysis
Looppanel is a next-generation platform that helps you analyze open-ended survey responses using AI. This researcher-centric tool combines the efficiency of AI with the nuanced understanding that only human researchers can provide. Notable companies like Thumbtack, PandaDoc, and Miro trust Looppanel for their UX research needs.
How to analyze open ended survey responses in Looppanel?
- Upload your data: Start by preparing your survey responses in a CSV file - include relevant columns like the response text, date, and any demographic information. Once ready, simply drag and drop your file into Looppanel. The platform accepts various file formats and can handle thousands of responses at once.
.png)
- Let AI analyze your data: After uploading, Looppanel's AI engine automatically starts analyzing your responses. It identifies key themes, sentiments, and patterns without any manual coding needed. The AI is trained explicitly on user research data, so it understands context better than general-purpose AI tools like ChatGPT.

- Review themes and insights: Open the analysis dashboard to see what the AI discovered. You'll find a breakdown of main themes, with exact numbers of how many people mentioned each topic. Each theme comes with supporting quotes directly from your respondents. The dashboard shows both high-level patterns and detailed breakdowns.
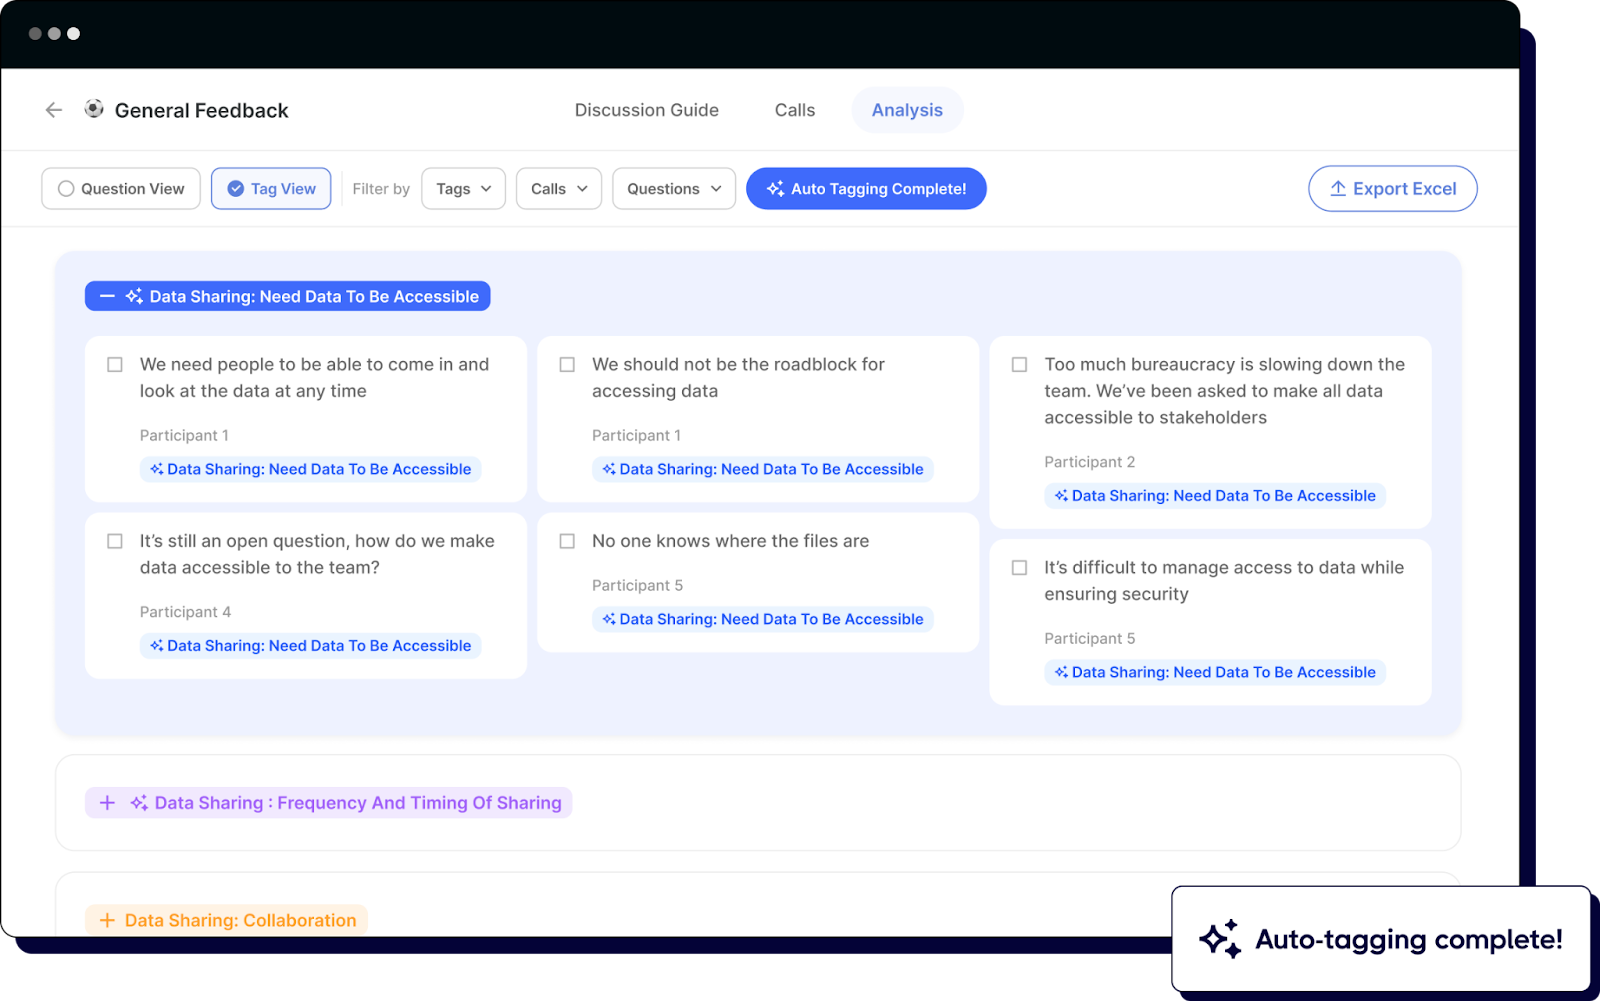
- Refine and customize: While the AI does the heavy lifting, you maintain full control. Rename themes to match your preferred terminology, merge similar topics, or create new categories. The AI learns from your adjustments, making future analysis even more accurate. You can also add your own tags and annotations to responses.

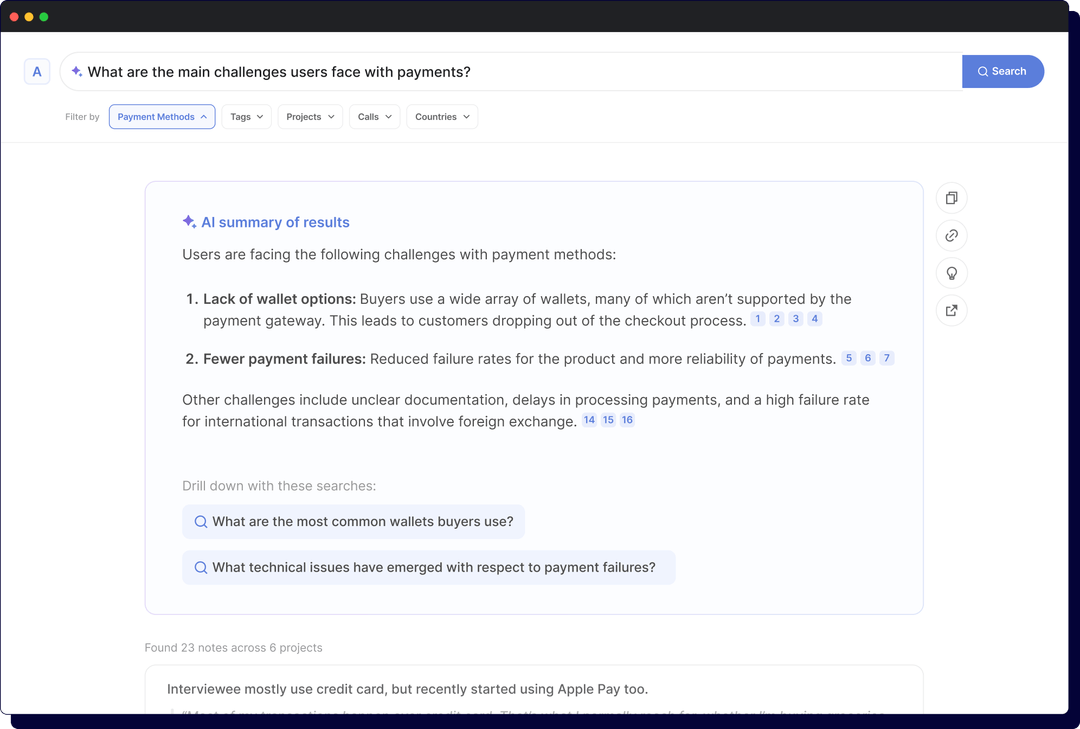
- Use AI search for deeper insights: Unlike traditional ctrl+F search, Looppanel's AI search understands context and meaning. Ask questions like "What are users saying about pricing?" or "Show me frustrated customers" to instantly find relevant responses, even if they don't use those exact words.
- Export and share findings: Export your analysis in various formats - spreadsheets for data processing, presentation-ready slides for stakeholders, or detailed reports for your research repository. Each export includes supporting quotes and quantitative breakdowns of themes, making it easy to back up your insights with data.
Key features
- Automated thematic analysis of open-ended responses
- AI-powered semantic search capabilities
- Quote extraction and categorization
- Theme frequency analysis
- Collaborative analysis tools
- Export capabilities for presentations and reports
Best For
- Research teams handling large volumes of qualitative data
- Organizations needing quick insights from open-ended survey responses
- Teams looking to balance efficiency with analytical rigor
- Projects with tight deadlines but high-quality requirements
2. Excel
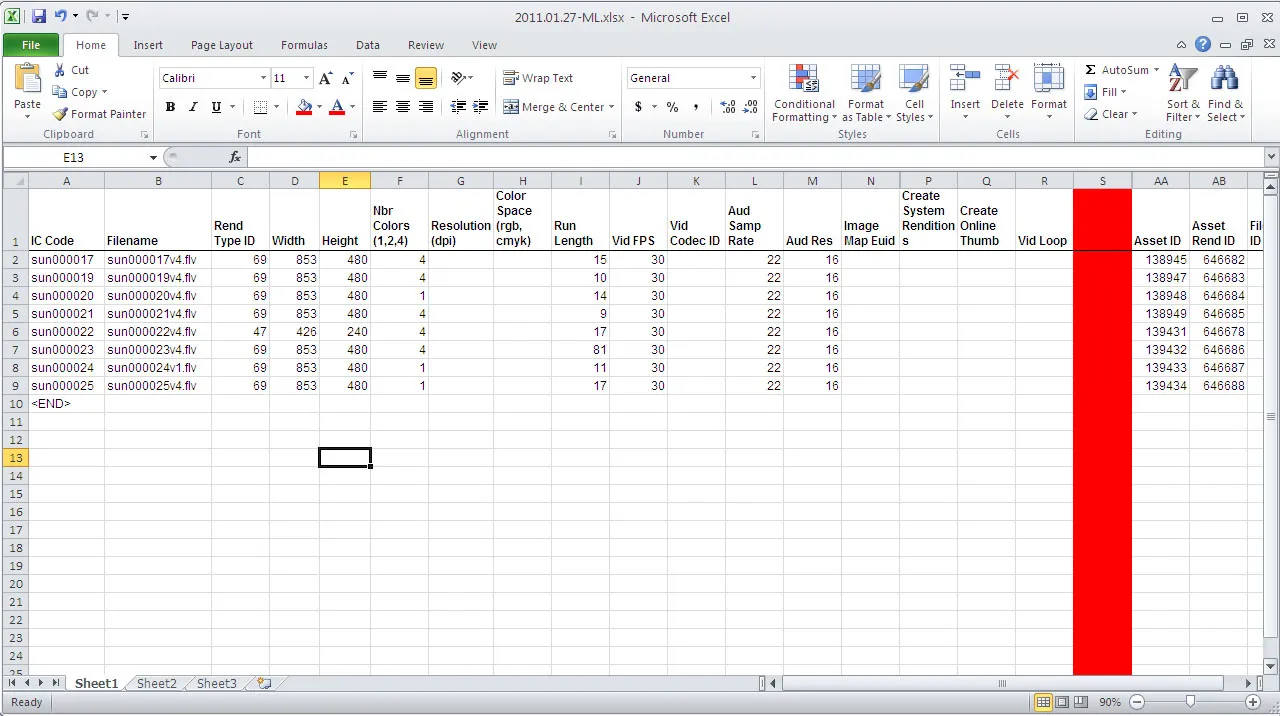
Excel is a popular tool for analyzing open-ended survey responses. It's easy to use, and most people already have it. While Excel is great for small projects, it gets messy with large amounts of data. Manual data entry can be time-consuming, and mistakes can happen when working with big datasets.
How to analyze open ended survey responses in Excel?
- Design your codeframe: Begin by creating a new sheet dedicated to your coding framework. Take time to list all potential themes and subthemes you expect to find in your responses. Assign unique codes to each theme to make tracking easier. Finally, create a comprehensive codebook that includes clear definitions and examples for each code to ensure consistency in your analysis.
- Sort your data: Start organizing your responses by relevant criteria such as date, demographic information, or other meaningful categories. Remove any invalid or incomplete responses that might skew your analysis. Create a clean, well-structured dataset that will serve as the foundation for your detailed analysis.
- Apply filters: Make use of Excel's powerful filter function to effectively sort through your responses. Create custom filters that help you identify specific keywords or patterns in the data. Implement conditional formatting to visually highlight key themes, making it easier to spot trends and patterns in your responses.
- Create pivot tables: Utilize pivot tables to summarize your coded data in meaningful ways. Generate frequency counts to understand how often different themes appear in your responses. Cross-tabulate various themes with other variables to uncover interesting relationships and patterns in your data.
- Code your data: Take time to read each response carefully and thoughtfully. Assign relevant codes from your codeframe, remembering that responses might require multiple codes to capture their full meaning. Stay alert for emerging themes that weren't in your original codeframe, and document these new patterns as they appear.
- Quality check: Review your coded data thoroughly to ensure consistency across all entries. Work with team members to cross-check your coding decisions and interpretations. If multiple coders are involved, calculate inter-rater reliability to verify consistency. Document any modifications made to the codeframe during the analysis process to maintain transparency.
Best for
- Small to medium-sized datasets
- Teams with limited budgets
- Projects requiring manual review of each response
- Basic quantitative analysis of qualitative data
3. ChatGPT
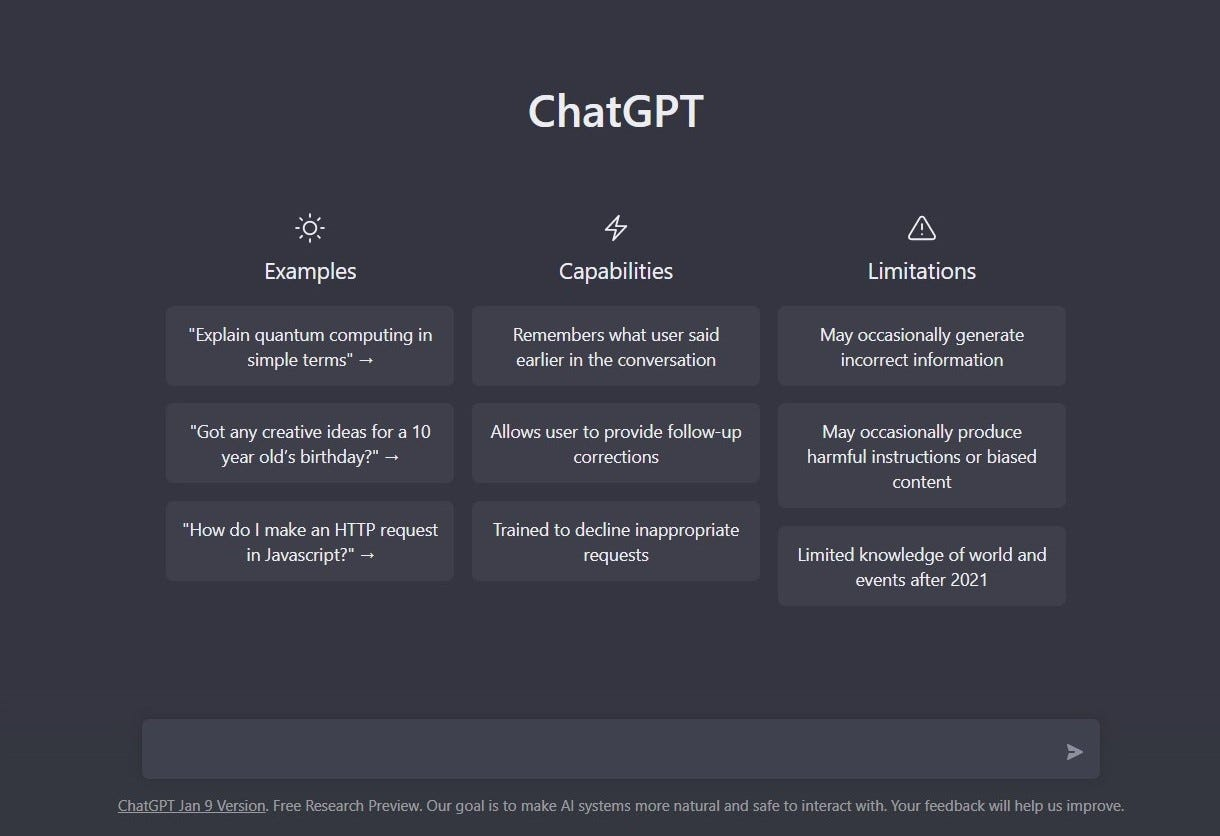
ChatGPT is a helpful AI tool that can quickly analyze your survey responses and find common themes. You can simply paste your data and ask it to identify patterns or summarize feedback. It's free to use and doesn't require special training. However, it has serious limitations. It can only handle about 3000 words at a time, which means you'll need to break up larger surveys into smaller chunks. This makes it impractical for big projects.
Also, ChatGPT sometimes misunderstands context or makes up patterns that aren't really there, so you'll need to double-check its work carefully.
How to use
1. Get your data ready: First, clean up your survey responses. Remove any personal information like names or emails. Since ChatGPT can only process about 3000 words at once, splits larger datasets into smaller parts.
2. Write clear prompts: Here are two proven prompts you can copy and use:
- For basic theme analysis:
Please analyze these survey responses and tell me:
1. What are the main themes?
2. What are people complaining about most?
3. What are people praising?
- For detailed feedback analysis:
Review these customer responses and:
1. Group similar feedback together
2. List the top problems customers mentioned
3. Highlight what customers liked
4. Suggest what should be fixed first
5. Include specific quotes as examples
3. Review and verify: Always check ChatGPT's analysis against your raw data. Look for any themes it might have missed or misinterpreted. Use its analysis as a starting point, not the final word.
Limitations
- 3000 words context window limit
- Potential for hallucinations or misinterpretation
- Privacy concerns (data may be used for training)
- Manual work required for large datasets
- Limited memory across conversations
Best for
- Quick preliminary analysis
- Non-sensitive data
- Small to medium datasets
- General theme identification
- Initial exploration of responses
4. MAXQDA
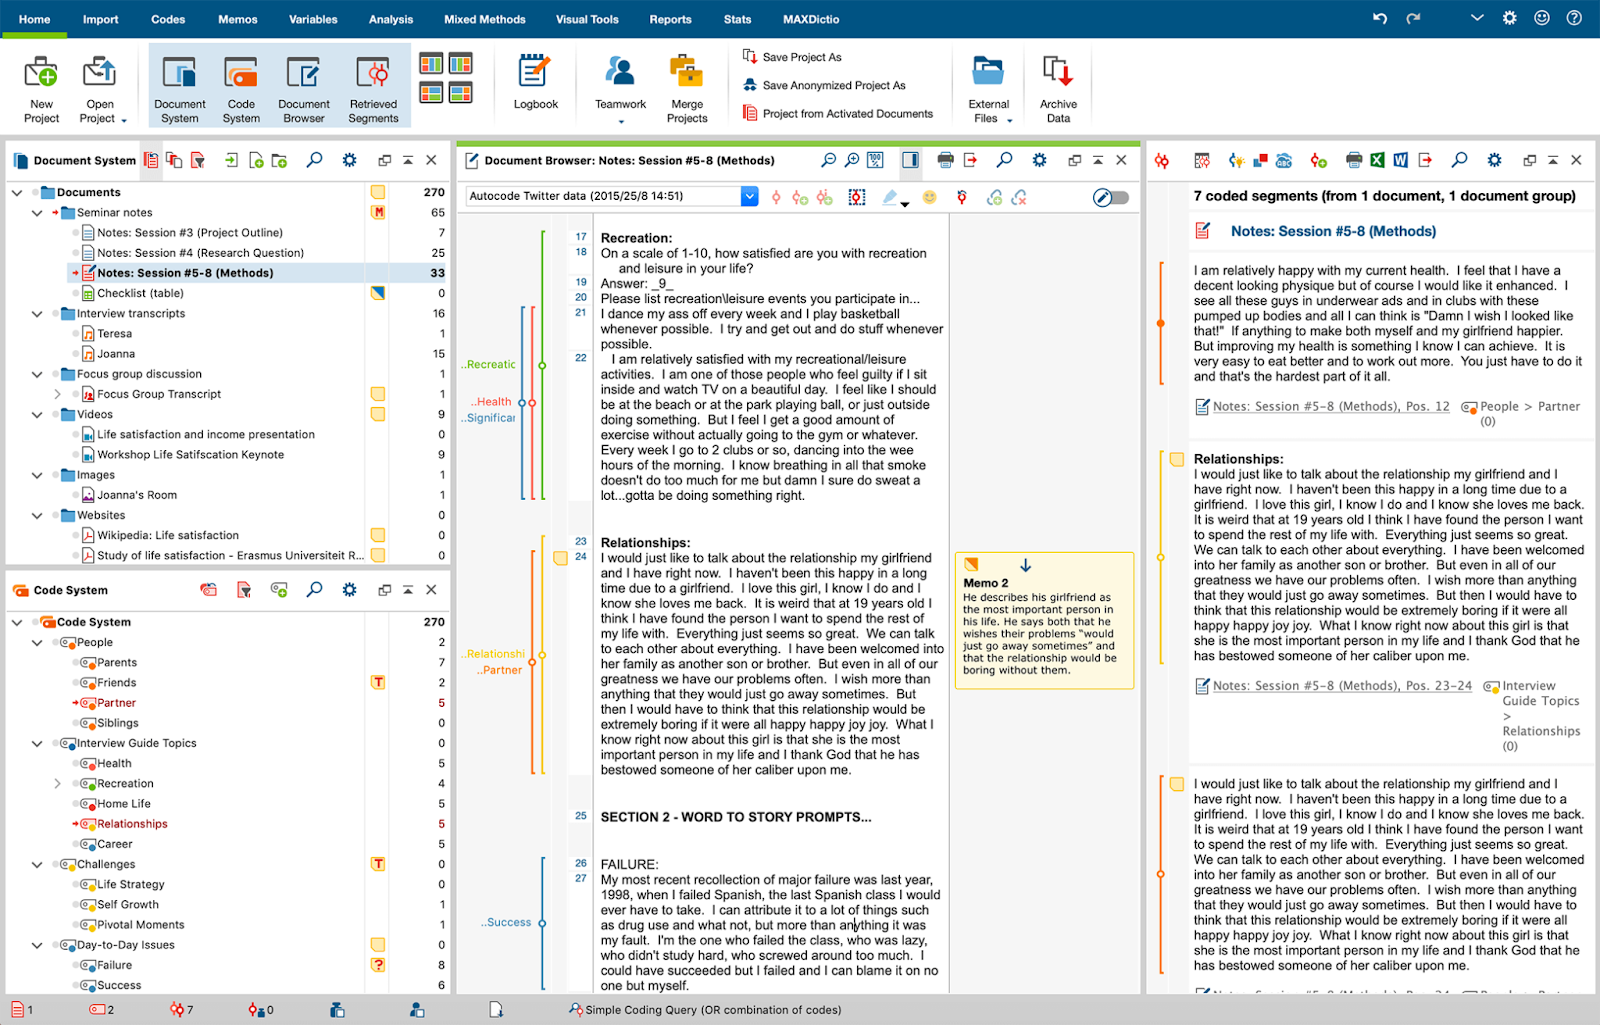
MAXQDA stands as a comprehensive solution for how to analyze open-ended survey responses, particularly suited for academic and scientific research. It combines powerful qualitative analysis capabilities with quantitative features and AI-assisted coding.
How to use
- Project setup: Start by importing all your survey responses into MAXQDA. Next, build your coding system based on your research goals. Set up document variables to track important information like demographics or dates. Finally, customize your visualization preferences to match how you want to see your data presented.
- Coding process: MAXQDA makes coding simple with its drag-and-drop interface. You can apply multiple codes to the same text at once, saving time. Organize your codes into hierarchies to show relationships between different themes. The auto-coding feature can give you a head start by identifying basic patterns in your data.
- Analysis features: The software offers both qualitative and quantitative analysis tools. Use the code relations browser to see how different themes connect. Create comparison charts to spot patterns across different groups. Generate word clouds and frequency tables to visualize your data. Run complex coding queries to find specific patterns, and use statistical tools to back up your findings.
- Visualization and export: Turn your findings into visual stories by creating relationship maps between different themes. Generate code matrices to show how often themes appear together. Export your work in various formats like PDF, Excel, or presentations. Create polished visualizations ready to share with your team or include in publications.
Best For
- Academic researchers
- PhD students and professors
- Complex research projects
- Mixed-methods analysis
- Detailed coding requirements
- Projects requiring rigorous methodology
What is Sentiment Analysis for Open-Ended Questions?
Sentiment analysis for open-ended questions is a powerful tool used to decode the emotions and opinions hidden in qualitative data.
When conducting surveys, researchers often face the challenge of interpreting vast amounts of unstructured text. This is where sentiment analysis comes into play, especially useful in understanding how participants feel about a topic.
Essentially, sentiment analysis examines words and phrases within open-ended responses to categorize them as positive, negative, or neutral. This approach allows researchers to quantify and systematically analyze sentiments that would otherwise require intensive manual interpretation.
For example, in UX research, understanding user sentiment helps refine products to meet user needs and expectations better.
How to do Thematic Analysis for Open-Ended Questions?
Thematic analysis is a qualitative research method used to identify, analyze, and report patterns (themes) within data. When applied to open-ended questions, researchers can explore the breadth of responses and distil them into actionable insights.
The process begins with familiarization: researchers immerse themselves in the data, reading and re-reading responses to gain a deep understanding of the content. The next step involves generating initial codes. This coding process involves noting down exciting features of the data that might form the basis of recurring themes.
As codes are collected, the researcher begins to group them into potential themes. It considers how different codes may form a coherent pattern. This stage often requires a lot of moving back and forth between the dataset and the coded extracts to check if the themes make sense.
Themes are then reviewed and refined, which may involve splitting, combining, or discarding themes to capture the data's essence better. The final phase of thematic analysis consists of defining and naming themes. It provides a detailed analysis of each theme and the data's overall story.
P.S. - Checkout our article on “Top 5 Tools for AI Thematic Analysis in 2025” to make this process easier and faster.
What Are Open-Ended Questions Analysis Examples?
Open-ended questions help gather richer details from respondents as they allow for more depth than closed-ended questions.
For example, in a customer satisfaction survey, instead of asking how satisfied customers are on a scale from 1 to 10, a company might ask, "What did you like most about our service?" This type of question can yield various responses and offers insights into customer preferences and experiences.
Analyzing these responses might reveal themes such as "speed of service," "customer care," and "product quality." Each theme can then be further examined to understand specific aspects that customers appreciate or areas needing improvement.
Another example could involve employee feedback surveys where open-ended questions like "How can the company improve your work experience?" allow the organization to gather detailed suggestions and share concerns that might not surface through predefined answers.
Reflection on Open-Ended Data Visualization in Practice
Visualizing data from open-ended questions can enhance the interpretability and communicability of qualitative research findings. Effective data visualization helps stakeholders understand the underlying patterns and themes without getting into more dense textual analyses.
For instance, word clouds can highlight frequently mentioned words or phrases in the responses. It offers a visual representation of the data's most prominent themes.
Another approach is to use affinity diagrams to organize themes and sub-themes visually. This can help in presenting how different themes are interrelated and the relative importance or frequency of each theme.
Charts such as bar graphs or pie charts can also show the percentage of responses falling under each theme. They provide a quantitative layer to the qualitative data.
Reflecting on these practices, it's clear that while visualization tools offer significant advantages, they must be chosen and designed carefully to reflect the complexity and depth of qualitative data.
Misrepresentation through oversimplification or inappropriate visualization strategies can lead to misinterpretations of the data. Therefore, a balanced approach that respects the data's qualitative nature while providing visual summaries can most effectively communicate findings from open-ended questions.
Redditors' Opinion on "How do you analyze open-ended responses from a large survey sample size?"
Redditors have shared various practical strategies and tools that can help streamline this process. Below, we explore three distinct approaches from Reddit users, highlighting different facets of handling qualitative data effectively.
Structured Thematic Analysis
One Redditor suggests a structured approach to thematic analysis:
- Begin by randomly selecting 10% of responses to analyze.
- Review these responses to identify emerging themes and organize them into a spreadsheet.
- As you read each response, mark relevant themes with an 'X' in corresponding columns, noting that comments can address multiple themes.
- Quantify the prevalence of each theme by counting the marks.
- Choose a representative quote for each theme and summarize the findings in a report.
Enhancing Human-Chatbot Collaboration
Another Redditor emphasizes the integration of AI, specifically ChatGPT, to optimize the analysis process:
- Start by defining ChatGPT’s role as an experienced UX designer/researcher to analyze open-ended survey responses.
- Clearly outline the expected output, including insights, theme frequency, importance, and actionable findings. Input a large batch of qualitative data for analysis.
- Utilize ChatGPT’s AI capabilities to organize and interpret the data, extracting valuable insights and clustering information effectively.
- To enhance proficiency, consider taking specialized courses to maximize the use of ChatGPT in UX research.
Balancing Automation with Human Insight
The third perspective highlights the use of automated tools alongside human analysis:
- Leverage survey tools with AI capabilities to automatically identify sentiments and topics in responses.
- Complement this with manual analysis to capture patterns that AI may overlook.
- Select compelling quotes that add a human element for stakeholders.
- To maximize the effectiveness of tools like ChatGPT in UX research, consider enrolling in specialized courses for deeper learning and certification.
Wrapping-Up
Analyzing open-ended survey responses offers deep insights into customer opinions, preferences, and experiences, which are essential for informed decision-making. The process involves meticulously coding responses, identifying recurring themes, and synthesizing them into actionable insights.
The integration of AI and machine learning promises to revolutionize this field. These technologies will streamline the analysis process, increasing efficiency and accuracy by automating the extraction of themes and sentiments. However, human oversight will remain crucial to accurately interpret nuanced expressions and contextual subtleties.
FAQs
Are Open-Ended Questions Easy to Analyze?
Analyzing open-ended questions can be complex due to the diversity and depth of responses. It requires thorough reading, identifying themes, and coding the data into manageable categories.
Although time-consuming, this analysis is invaluable for uncovering nuanced insights that closed-ended questions might miss. It offers a richer understanding of respondents' perspectives.
How to Create a Survey?
To create a survey, clearly define your research goals to ensure your questions directly address your objectives. Design clear and unbiased questions, incorporating closed and open-ended questions to gather comprehensive data.
Utilize survey software to build and distribute the survey, ensuring it's accessible across devices. Finally, pilot your study with a small group to identify issues before full deployment.
How to analyze survey text responses?
Analyzing open-ended survey responses is about finding patterns in text feedback. First, organize all responses in a digital format. Then, identify common themes by reading through responses and grouping similar ideas together. Use analysis software to help spot patterns and count how often themes appear. This process turns unstructured feedback into clear insights about user experiences.
How do you analyze open-ended survey responses in research?
- Initial review Read through all responses to get a general sense of what people are saying and spot obvious patterns.
- Code your data Tag important words or phrases that capture key ideas. You can do this manually or use software to help speed things up.
- Find themes Group similar codes together to form broader themes. For example, several comments about a confusing button might form a "navigation issues" theme.
- Check sentiment Use tools to understand if responses are positive, negative, or neutral. This adds emotional context to your themes.
- Organize in Excel Sort and filter your coded data to spot patterns. For example, you might look at all negative feedback about a specific feature.
- Create action items Turn your findings into clear next steps. Focus on changes that will address the most common or critical issues users mentioned.
How to analyze qualitative responses?
Qualitative responses provide rich insights into user experiences. Here's how to effectively analyze them:
- Understand the basics: Qualitative analysis turns text data (like survey responses or interview notes) into meaningful insights. The goal is to spot patterns that can guide your decisions.
- Code your data: Read through responses and tag important points with keywords. For example, tag comments about hard-to-find features as "navigation issues."
- Find themes: Group similar codes together into broader themes. If you see "confusing menus" and "can't find buttons" often, these might form a "usability problems" theme.
- Create insights: Turn your themes into actionable insights. Ask: What do these patterns tell us? What specific problems need fixing? Work with your team to brainstorm solutions.
- Report findings: Share your discoveries clearly and briefly. Focus on the most important themes and back them up with specific examples. Always include recommended next steps.


.jpeg)
.svg)


