


However, gathering data is just the first step. The real magic happens during analysis, where raw data transforms into actionable insights. This is where good user research software come into play, revolutionizing how we understand and interpret user data.
What are the different types of UX research analysis?
UX research analysis typically falls into two main categories: qualitative and quantitative. Each type uses different methods and tools to make sense of data, providing unique insights that, when combined, offer a comprehensive understanding of user behavior and preferences.
How can I analyze my qualitative data?
Qualitative data analysis looks at non-numerical information like interview transcripts, open-ended survey responses, or user feedback. It aims to find patterns, themes, and insights in this rich, contextual data. Tools for qualitative data analysis are essential in this process, helping researchers organize, code, and interpret large amounts of unstructured data.
What are the 5 methods to analyze qualitative data?
This method uses qualitative data analysis tools to examine the frequency of words or themes in text data. It's particularly useful for analyzing large datasets and identifying trends.
Researchers identify and examine patterns or themes across data sets. This method is versatile and can be applied to various types of qualitative data.
Narrative Analysis
This approach focuses on the stories people tell, looking at how they structure their experiences. It's particularly useful in UX research for understanding user journeys and experiences.
Grounded Theory
This method builds theories from the data itself, rather than starting with a hypothesis. It's an iterative process that involves constantly comparing data to develop a theory.
Discourse Analysis
This examines how language is used in specific contexts. In UX research, it can be particularly useful for understanding how users talk about and perceive products or services.
What are the 4 types of quantitative analysis?
Quantitative data analysis tools help researchers make sense of numerical data. Here are the four main types of quantitative analysis:
Descriptive Analysis
This type summarizes data using measures like mean, median, mode, or standard deviation. It provides a snapshot of what the data looks like.
Inferential Analysis
This uses sample data to make predictions or inferences about a larger population. It's crucial for generalizing findings from user research.
Diagnostic Analysis
This type looks at why something happened. In UX research, it might be used to understand why certain features are more popular than others.
Predictive Analysis
This uses past data to forecast future trends. It's particularly useful for anticipating user needs and behaviors.
What is a user research tool?
A user research software is software that helps researchers collect, organize, and analyze data from user studies. These tools can handle various data types and research methods, from surveys and interviews to usability tests and analytics.
UX research analysis tools are designed to streamline the research process, making it easier to uncover insights and share findings with stakeholders. They can range from simple survey tools to complex platforms that integrate data collection, analysis, and reporting.
What are the research analysis tools for UX?
UX researchers use a variety of tools to analyze their data. Some popular ones include:
- AI qualitative data analysis tools like NVivo, Atlas.ti, and Looppanel. These tools help researchers code and analyze unstructured data from interviews, open-ended surveys, and usability tests.
- Quantitative data analysis tools such as SPSS, R, and Excel. These are used for statistical analysis of numerical data, such as task completion times or satisfaction scores.
- Mixed-method user research analysis tools like Qualtrics and MAXQDA. These platforms allow researchers to collect and analyze both qualitative and quantitative data in one place.
- Specialized user experience research tools like UserTesting, Hotjar, and Optimal Workshop. These focus on specific aspects of UX research, such as usability testing or information architecture.
What tool is used to analyze qualitative data?
Let's dive deeper into some of the leading tools for qualitative data analysis:
Tools for Qualitative Data Analysis
Qualitative data analysis tools are essential for UX researchers to uncover insights from unstructured data. Let's explore some of the top tools for each type of qualitative analysis.
What tool is used to analyze qualitative data?
Under content analysis, Looppanel is a great AI-powered option. Looppanel also works if you’re looking for tools to help you with thematic analysis, along with Nvivo. For narrative analysis, Atlas.ti and Delve are our top choices. Delve is also great for grounded theory analysis, along with MAXQDA. For discourse analysis, try MAXQDA or Quirkos.
Content analysis
Content analysis tools help researchers examine the frequency and context of words or themes in text data. Looppanel can help you with this.
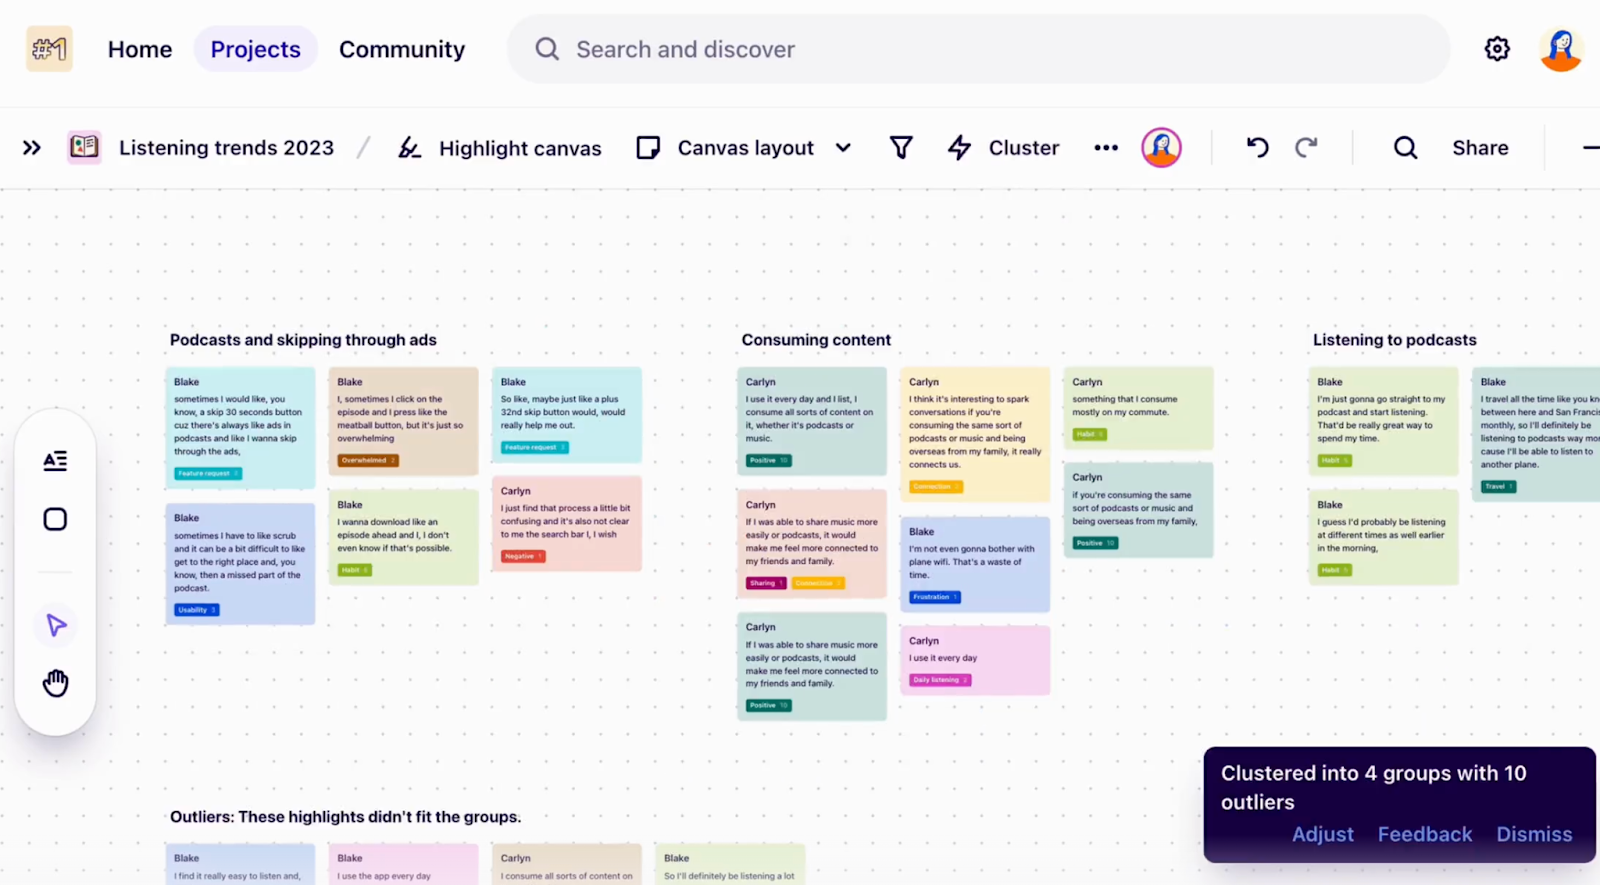
Looppanel

What does it do?
Looppanel is an AI-powered research assistant that excels in content analysis by automating the process of identifying and quantifying themes in qualitative data.
Highlights:
- Generates high-quality transcripts across languages with over 90% accuracy in minutes.
- Performs sentiment analysis on your call transcripts with color-coding for questions, positive, and negative responses.
- Provides automatic, human-like notes of your calls, organized by interview questions.
- Automatically tags data into common themes and issues.
- Offers Google-like search across your workspace to find any data snippet or quote.
- The AI-summary feature is a game-changer. You can ask the AI research assistant any question, and it’ll find the data most relevant to your query from your project, with a summary (including citations!)
Curious to try it out? Book a free demo of Looppanel here.
Pricing: Starts at $30 per month, with a free trial available.
How to use it
Sign up, paste in your discussion guide, and upload your user interview recordings or transcripts. Alternatively, you can also add your Google Calendar on Looppanel, and let the tool directly join you on calls as a note-taker, record and generate transcripts by the time you’re done talking!
Once the files are provided, Looppanel automatically generates notes from user interview recordings and transcripts, assigning them to relevant interview questions.
How it helps you analyze the data
For content analysis, Looppanel's automatic tagging and theme identification features are particularly valuable. Instead of manually sorting through notes one by one, Looppanel's AI automatically identifies common themes and subtopics across your files. The system tags relevant sections, creating an organized structure you can later edit and refine as needed. The AI-generated notes and sentiment analysis also help you quickly identify key themes and patterns in your data, streamlining the content analysis process.
The AI-summary and repository search features across multiple projects, allows for comprehensive content analysis.
Dovetail
What does it do?
Dovetail is a research repository and analysis platform built for UX teams to store, analyze, and share research data.
Highlights:
- Transcribes interviews in 28 languages with timestamps
- Offers multiple data views including boards, tables, clusters, lists, and grids
- Lets you create and maintain detailed tagging taxonomies across projects
- Provides smart search to find insights across your research database
- Analyzes data from multiple sources like reviews, support tickets, and interview
Pricing: Free plan available, paid plans start at $29/user/month (annual billing)
How to use it:
Upload your research recordings for transcription, then tag and organize data using Dovetail's taxonomy system. Create different views of your data using boards or tables. Search across projects using tags to surface relevant insights.
How it helps you analyze the data:
Dovetail has a robust tagging-taxonomy system that is the backbone of the tool. For content analysis, this can both be a blessing and a curse. Maintaining such an intensive tagging system can be a lot of work, but everything depends on it, including search across multiple projects. AI features would actually make a lot of difference here, but Dovetail is currently not the best at integrating them well into the researcher’s workflow.
Thematic analysis
Thematic analysis tools help researchers identify and examine patterns or themes across data sets. Two notable options are:
Looppanel
What does it do?
In the context of thematic analysis, Looppanel uses its AI capabilities to automatically identify and suggest themes across your qualitative data.

How to use it
Upload your interview data, and let Looppanel's AI suggest themes. You can then refine these themes, add your own, and organize them into a coherent thematic structure.
How it helps you analyse the data:
Looppanel's AI-driven theme suggestion accelerates the initial stages of thematic analysis. Its organizational tools then allow you to refine and structure these themes, facilitating a comprehensive thematic analysis of your data.
NVivo

What does it do?
NVivo is a comprehensive qualitative data analysis tool that excels in thematic analysis, helping researchers organize, analyze, and find insights in unstructured data.
Highlights:
- Handles various data types including text, audio, video, and images.
- Offers powerful coding and query tools for in-depth analysis.
- Provides visualization features for presenting findings effectively.
- Uses AI-powered coding to speed up the coding process.
- Includes collaboration features suitable for team-based research projects.
Pricing: Custom pricing, with options for academic and commercial use.
How to use it:
Transcribe user interviews (you can use Nvivo Transcription for this) and import the transcripts into NVivo. Use NVivo's coding tools to categorize user feedback by themes, topics, sentiment, and more. Explore coded data to identify patterns and insights that address your research questions. Visualize themes and relationships using NVivo's data visualization features.
How it helps you analyze the data:
NVivo's robust coding system is particularly suited for thematic analysis. It allows you to create a detailed coding structure, facilitating the identification and organization of themes. Its query tools help you explore relationships between themes, supporting a nuanced thematic analysis. The visualization features enable you to represent complex relationships between themes, enhancing your ability to communicate insights effectively.
Narrative analysis
Narrative analysis tools focus on examining the stories people tell and how they structure their experiences. Two powerful options are:
Atlas.ti

What does it do?
Atlas.ti is a robust platform designed for thorough qualitative and mixed-methods research, with features that make it particularly suitable for narrative analysis.
Highlights:
- Supports multimodal data analysis, handling text, audio, video, and images.
- Offers robust coding and analysis tools, including open coding, in-vivo coding, and AI-powered automatic coding.
- Provides visual data exploration tools to identify patterns and relationships within narratives.
- Facilitates real-time collaboration for team-based projects.
- Includes comprehensive project management features for effective data organization.
Pricing: Custom pricing
How to use it
Import your narrative data (e.g., transcripts, audio files) into Atlas.ti. Create a new project and organize your documents within it. Code the narrative data by highlighting relevant segments and applying descriptive codes. Use the memo feature to document reflections during the coding process. Analyze relationships between codes and visualize connections using the network and diagram features. Generate reports and export findings for further analysis or presentation.
How it helps you analyse the data
For narrative analysis, Atlas.ti's robust coding capabilities enable researchers to identify and categorize key themes, characters, and events within narratives. The visualization tools facilitate mapping relationships between different narrative elements, uncovering patterns and insights that may not be immediately apparent.
Delve

What does it do?
Delve is a qualitative analysis tool designed to assist researchers in narrative analysis, offering features that enhance the exploration and interpretation of narrative data.
Highlights:
- Features an AI Assistant that acts as a virtual peer debriefer to review and discuss findings.
- Provides an ultra-simple, intuitive interface that allows researchers to focus on qualitative analysis rather than learning the tool.
- Offers a flexible coding system that evolves with the research process, allowing for nested and merged codes.
- Enables researchers to view data from different dimensions, including by code, pattern, and demographic information.
- Includes backlink functionality to trace findings back to raw data, enhancing result verification.
Pricing: Free trial available, plans start at $50 per month per user
How to use it
Create a new project in Delve and import your narrative data. Begin coding by selecting relevant text segments and applying appropriate codes. Engage with the AI Assistant to explore alternative perspectives and streamline coding iterations. Use the flexible coding system to adapt to your evolving insights. Utilize the multi-dimensional view to examine your data from different angles. Use backlinks to trace insights back to original quotes when presenting findings.
How it helps you analyze the data
Delve aids in narrative analysis by providing a user-friendly interface that allows researchers to focus on finding accurate insights rather than struggling with complex software. The AI Assistant acts as a virtual peer, helping to explore alternative perspectives and enrich the research process. The flexible coding system adapts to the evolving nature of qualitative analysis, while the multi-dimensional view allows researchers to see data in new ways. This approach helps ensure that insights are representative of all participants, reducing bias.
Grounded theory analysis
Grounded theory analysis tools help researchers build theories from the data itself. Two excellent options are:
Delve
What does it do?
For grounded theory analysis, Delve provides a flexible platform that supports the iterative process of theory building from qualitative data.
How to use it:
Start by open coding your data in Delve. As patterns emerge, use Delve's flexible coding system to refine your codes and develop categories. Use the visualization tools to map out relationships between categories as your theory develops. As your theory develops, use the backlink feature to ensure all theoretical constructs are grounded in the data.
How it helps you analyze the data:
For Grounded Theory analysis, Delve's flexible coding system is particularly valuable. It allows for the constant comparative method essential to Grounded Theory, enabling researchers to easily refine and reorganize their coding structure as their theory emerges. The AI Assistant can serve as a virtual peer debriefer, helping to challenge assumptions and explore alternative theoretical explanations.
The intuitive interface ensures that researchers can focus on the complex cognitive work of theory building rather than struggling with software technicalities.
Furthermore, Delve's backlink functionality is crucial for maintaining the 'grounded' nature of Grounded Theory. It allows researchers to easily trace their theoretical constructs back to the raw data, ensuring that the developed theory remains firmly rooted in empirical evidence. This feature is particularly useful when presenting and defending the developed theory to peers or in publications.
MAXQDA
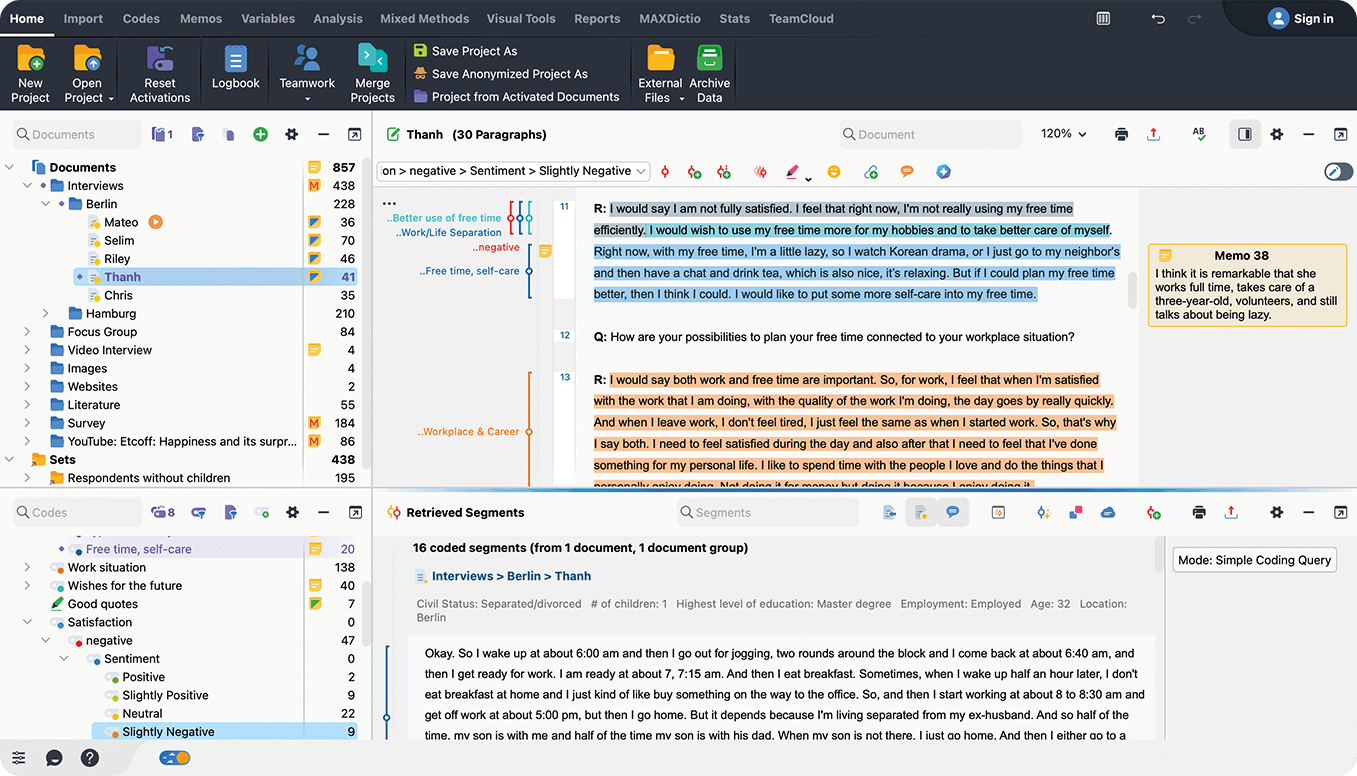
What does it do?
MAXQDA is a versatile tool for qualitative and mixed methods research, with features that make it well-suited for grounded theory analysis.
Highlights:
- Handles qualitative, quantitative, and mixed methods research.
- Offers powerful text analysis tools for in-depth language analysis.
- Provides visualization options for presenting results effectively.
- Includes an AI Assist feature that allows you to chat with your data, get summaries, and even definitions of tricky terms.
- Features visual mapping tools to create concept maps showing relationships in your data.
Pricing: Custom
How to use it:
Import your data into MAXQDA. Use its coding and analysis tools to develop your grounded theory. The visual mapping tools can help you illustrate the relationships between concepts as your theory develops.
How it helps you analyse the data
For grounded theory analysis, MAXQDA's comprehensive toolset allows you to move seamlessly between open coding, axial coding, and selective coding. Its visual mapping tools are particularly useful for representing the relationships between categories in your developing theory.
Discourse analysis
Discourse analysis tools help researchers examine how language is used in specific contexts. Two strong options are Quirkos and MAXQDA.
Quirkos
What does it do?
Quirkos is a user-friendly qualitative analysis tool that can be effectively used for discourse analysis, focusing on the visual representation of language patterns and themes.
Highlights:
- Offers an intuitive drag-and-drop interface for coding, with visual "Quirks" (bubbles) representing themes.
- Provides real-time collaboration features, allowing unlimited simultaneous users at no extra cost.
- Supports flexible coding structures, including sub and sub-sub categories.
- Features unique side-by-side views for comparing quotes and results from different groups or sources.
- Includes automated transcription service for audio and video files.
- Offers cross-platform compatibility (Windows, Mac, Linux, and web browsers including tablets and smartphones).
Pricing: Starts at $5 monthly for a Student plan
How to use it
Import your data into Quirkos, including PDFs, Word documents, spreadsheets, or transcribed audio/video files. Begin open coding by dragging and dropping text selections onto "Quirks" (bubble-shaped codes).
As you code, Quirks grow in size to visually represent the importance of emerging themes. Use the flexible categorization system to develop your coding structure as your theory emerges. Utilize the visualization tools to explore connections and overlaps in your data.
How it helps you analyze the data
Quirkos' visual approach to coding helps researchers quickly identify emerging themes, crucial for the constant comparative method in grounded theory. The flexible coding structure allows for easy reorganization of codes as the theory develops.
Real-time collaboration features facilitate team-based theory building, while the ability to view quotes in context helps ensure the developing theory remains grounded in the data.
MAXQDA
What does it do?
In the context of discourse analysis, MAXQDA offers advanced text analysis features that are particularly useful for examining language use in depth.
How to use it:
Import your textual data into MAXQDA. Use its lexical search and coding tools to identify and mark up elements of discourse. Use the visualization tools to represent relationships between these elements.
How it helps you analyze the data
MAXQDA's advanced text analysis features are particularly valuable for discourse analysis. Its ability to search for and visualize language patterns helps you identify discourse structures and patterns, while its mixed methods capabilities allow you to integrate quantitative aspects into your discourse analysis if needed.
Tools for Quantitative Data Analysis
Descriptive Statistics
Descriptive statistics summarize and describe the main features of a dataset, helping researchers understand the basic characteristics of their data. Qualtrics and XLSTAT are two great tool options for running quantitative data analysis.
Qualtrics

What does it do?
Qualtrics is an all-in-one platform for survey creation, data collection, and statistical analysis.
Highlights:
- Advanced survey design with various question types, including multiple-choice, matrix, and text entry
- Real-time data analysis as responses come in, with built-in statistical tools for immediate insights
- Cross-tabulation to compare responses across different demographic groups or survey questions
- Customizable dashboards for data visualization through charts and graphs
- Easy data export to formats like CSV, Excel, and SPSS for further analysis
- Automated reporting features to summarize findings effectively
Pricing: Contact the Qualtrics team to know more about pricing
How to use it
To use Qualtrics for quantitative data analysis, start by designing your survey using the platform's intuitive survey builder. Choose appropriate question types based on your research objectives. Once your survey is distributed and responses are collected, navigate to the "Data & Analysis" tab to view real-time results. Utilize the built-in statistical analysis tools to perform cross-tabulations and generate reports. You can customize dashboards to visualize your data effectively. Finally, export your data in your preferred format for more detailed analysis if needed.
XLSTAT

What does it do?
XLSTAT is a powerful statistical software add-on for Microsoft Excel by Lumivero, offering a wide range of analytical tools.
Highlights:
- Wide range of statistical tests including regression analysis, ANOVA, factor analysis, and clustering
- Advanced data visualization tools such as graphs, charts, and PCA plots
- Familiar Excel interface for ease of use
- Customizable reports that summarize findings and include graphical representations of data
- Variety of descriptive statistics tools available in the Describing data menu
- Outputs for quantitative data include statistics like min/max value, quartiles, mean, variance, and standard deviation
- Graphs for quantitative data include box plots, scattergrams, Q-Q plots, and stem and leaf plots
- Outputs for qualitative data include frequency, percentage, and relative frequency of categories
- Graphs for qualitative data include bar charts, pie charts, and stacked bars
Pricing: XLSTAT offers a free version, paid plans start at $295
How to use it
To use XLSTAT for quantitative data analysis, first install the XLSTAT add-on in Microsoft Excel. Open your dataset in Excel and select the XLSTAT tab. Choose the appropriate analysis method from the XLSTAT menu, such as regression or ANOVA, and follow the prompts to configure your analysis settings. For descriptive statistics, select the Describing data menu and choose the Descriptive Statistics feature. Select your data on the Excel sheet, set up the dialog box with your desired outputs, and click OK. Once the analysis is complete, view the results directly in Excel, where you can also create visualizations and generate reports based on your findings.
Inferential Statistics
Inferential statistics use sample data to make predictions or inferences about a larger population, allowing researchers to test hypotheses and draw broader conclusions.
IBM SPSS Statistics
What does it do?
IBM SPSS Statistics is a comprehensive statistical software package for advanced quantitative analysis.
Highlights:
- Extensive range of statistical procedures, including descriptive statistics, regression, ANOVA, and non-parametric tests
- Powerful data management capabilities for easily managing and manipulating large datasets
- Advanced data visualization tools for creating a variety of charts and graphs
- Automated reporting features to generate detailed summaries of analysis results
- Data cleaning and transformation tools
- Ability to handle complex sampling designs and weighting
- Integration with other data sources and formats
Pricing: Starts at approximately $99 per month.
How to use it:
To use IBM SPSS Statistics for quantitative data analysis, start by importing your dataset into the software. Use the data editor to clean and prepare your data as needed. Select the appropriate analysis method from the "Analyze" menu, configure the settings based on your research questions, and run the analysis. SPSS will generate output tables and charts that display your results. You can then use the output viewer to interpret your findings, create custom visualizations, and generate comprehensive reports. The software's automated features can help streamline the analysis process, while its extensive statistical capabilities allow for in-depth exploration of your data.
Correlation Analysis
Correlation analysis examines the relationship between two or more variables, helping researchers understand how changes in one variable might be associated with changes in another.
BKSV's Correlation Analysis Software
What does it do?
BK CONNECT TYPE 8421 is specialized software for correlation analysis in modal testing, comparing finite element models with test models.
Highlights:
- Visual and numerical comparison of two modal models
- Guided workflow for geometry alignment, degree of freedom (DOF) mapping, and mode pairing
- Test planning and validation tools to design optimal test conditions
- Import capabilities for various model formats including Nastran, ANSYS, and ABAQUS
- AutoMAC, CrossMAC, auto-orthogonality and cross-orthogonality tables and 3D plots
- SEREP algorithm for expanding test modal vectors to FE space
- Integrated Microsoft Office reporting capabilities
Pricing: Not publicly available; contact BKSV for pricing information.
How to use it:
To use BK CONNECT TYPE 8421 for correlation analysis, start by importing your test modal model and finite element (FE) model into the software. Use the guided workflow to align and scale the geometric models, ensuring they match for comparison. Perform degree of freedom (DOF) mapping to match the DOFs from the two models being correlated. Run the correlation analysis, which will automatically pair modes between the two modal models based on frequency or shape correlation. You can then animate and compare mode shapes, view mode tables, and analyze the correlations between the models. The software's visualization tools help identify discrepancies between the test and FE models. Finally, use the integrated reporting capabilities to generate comprehensive reports of your findings, which can be used to improve both testing and modeling processes.
How to select the best UX research tool
Choosing the right UX research tool is crucial for conducting effective user research and deriving meaningful insights. When selecting a tool, consider your specific research needs, team size, and budget constraints. Look for tools that offer features aligned with your research methodologies, such as survey creation, user testing, or data analysis capabilities. Consider the tool's ease of use, as a steep learning curve can hinder productivity. Evaluate the tool's collaboration features, especially if you work with a distributed team. Data security and compliance with privacy regulations are also critical factors, particularly when handling sensitive user information. Additionally, consider the tool's integration capabilities with your existing workflow and other software. It's often beneficial to trial different tools before committing to one, as hands-on experience can reveal whether a tool truly meets your needs. Remember that the best tool is one that enhances your research process without overshadowing the importance of sound research methodologies and critical thinking.
Redditors' opinion
According to discussions on Reddit, the consensus among UX professionals is that while tools are important, they shouldn't be the primary focus when starting out in UX research. Here are some key points from their discussions:
- Focus on research methods: Understanding various research methods and when to apply them is more crucial than mastering specific tools. Formulating good research questions should be the starting point.
- Start simple: Beginners can get far with basic tools like post-it notes, a notebook, and Excel. Complex tools aren't necessary to conduct effective research.
- Adaptability is key: Tools change frequently, and companies often dictate which ones to use. Learning to adapt to different tools is more valuable than expertise in any single one.
- Consider user experience: Sometimes, simpler tools like Zoom or Google Meet can be more effective for user research than specialized software that might complicate the process for participants.
- Continuous learning: The field of UX is constantly evolving. Stay open to learning new methods and tools as they emerge, but focus on understanding the underlying principles of good UX research.
Emerging trends in UX tools for 2025
As we look towards 2025, several exciting trends are emerging in UX research tools.
AI-powered analysis is becoming increasingly sophisticated, offering faster and more in-depth insights from complex datasets. This technology is enabling researchers to uncover patterns and user behaviors that might have been previously overlooked.
Remote research capabilities are also evolving rapidly, with tools offering enhanced features for conducting and analyzing user studies from afar, reflecting the ongoing shift towards distributed work environments.
Data privacy measures are becoming more robust, with tools incorporating stronger security features to protect sensitive user information, addressing growing concerns about data protection.
Cross-platform compatibility is improving, with more tools offering seamless experiences across various devices and operating systems, allowing researchers to work efficiently regardless of their tech setup.
Perhaps most notably, we're seeing a trend towards the integration of quantitative and qualitative data analysis within single platforms. These integrated tools are enabling researchers to blend different types of data for more comprehensive insights, bridging the gap between numbers and narratives to paint a fuller picture of the user experience.
Streamline with tools and lead with UX research skills
The true value in UX research comes from the researcher's skills in designing effective studies, asking insightful questions, and interpreting data within the broader context of user needs and business goals. Tools can help organize data and visualize results, but it takes a skilled researcher to translate these findings into actionable recommendations that drive meaningful improvements in user experience.
As the field evolves, the most successful UX professionals will be those who can balance tool proficiency with core research skills like empathy, critical thinking, and effective communication. They will know when to rely on advanced tools and when simple methods might yield better results.
By continuously developing both technical and soft skills, UX researchers can ensure they're not just collecting data, but generating valuable insights that can shape product development and business strategy.
In this way, while tools streamline the process, it's the researcher's skills that truly lead the way in creating impactful user experiences.
Frequently Asked Questions (FAQs)
What are the 3 research tools in collecting qualitative data?
The three primary UX research tools for collecting qualitative data are interviews, focus groups, and observations. These tools for qualitative data analysis are essential in gathering rich, contextual information about user experiences. Interviews allow researchers to delve deep into individual perspectives, while focus groups facilitate group discussions to uncover diverse viewpoints. Observations involve watching and recording user behavior in natural settings, providing invaluable insights into how people interact with products or services. These qualitative data analysis tools, when used in combination, offer a comprehensive approach to understanding user needs, motivations, and pain points. User research analysis tools like NVivo or Atlas.ti can then be employed to organize and analyze the data collected through these methods, helping researchers identify patterns and themes across different data sources.
What are the UX analytics methods?
UX analytics methods encompass a wide range of approaches, combining both qualitative and quantitative techniques to provide a comprehensive understanding of user experience. Qualitative methods, supported by tools for qualitative data analysis, include user interviews, usability testing, and contextual inquiry. These methods provide in-depth insights into user behavior and preferences. On the quantitative side, UX research analysis tools facilitate methods such as A/B testing, click tracking, and conversion rate analysis, offering numerical data to measure user interactions. Heatmaps and user flow analysis, generated by specialized UX research analysis tools, visualize how users navigate through a product. The integration of both qualitative and quantitative data analysis tools allows researchers to triangulate findings, providing a more robust understanding of user experience. This holistic approach, combining various analysis tools for qualitative data with quantitative methods, enables UX professionals to make data-driven decisions that improve overall user satisfaction and product performance.
What statistical tool to use for qualitative research?
While AI for qualitative research primarily deals with non-numerical data, certain statistical tools can be valuable for analyzing patterns in qualitative data. Content analysis software, such as NVivo or Atlas.ti, are powerful qualitative data analysis tools that can help identify themes and calculate frequencies of codes. These tools for qualitative data analysis allow researchers to organize, code, and analyze textual data systematically. Some user research analysis tools also offer basic statistical functions that can be applied to qualitative data, such as frequency counts of themes or sentiment analysis. It's important to note that while these tools can assist in identifying patterns, the interpretation of qualitative data still relies heavily on the researcher's analytical skills. The choice of analysis tools for qualitative data should be guided by the research questions and the nature of the data collected, ensuring that the richness and nuance of qualitative information are preserved throughout the analysis process.
What are the instruments for qualitative data analysis?
Instruments for qualitative data analysis encompass both software tools and manual techniques. Popular software tools include NVivo, Atlas.ti, and MAXQDA, which are robust qualitative data analysis tools that help researchers code and analyze textual data. These user research analysis tools offer features like thematic coding, data visualization, and query capabilities. Manual instruments include coding frameworks, thematic analysis guides, and data visualization techniques like mind mapping. These tools for qualitative data analysis aid researchers in identifying patterns, themes, and insights from unstructured data. Additionally, some researchers use collaborative platforms as analysis tools for qualitative data, allowing teams to work together on coding and interpretation. The choice of instruments often depends on the research methodology, the volume of data, and the specific analytical approach being used. Ultimately, these qualitative data analysis tools, whether digital or manual, serve to organize, structure, and make sense of complex qualitative data, enabling researchers to draw meaningful conclusions from their studies.
What are the two commonly used tools in quantitative data analysis?
Two of the most commonly used quantitative data analysis tools in UX research are SPSS (Statistical Package for the Social Sciences) and Microsoft Excel. SPSS is a powerful statistical software package that offers a wide range of analytical capabilities, from basic descriptive statistics to advanced multivariate analyses. It's particularly useful for handling large datasets and conducting complex statistical tests. Excel, while more basic, is widely used for its accessibility and ability to handle smaller datasets and create simple visualizations. Both these quantitative data analysis tools play crucial roles in processing and interpreting numerical data in UX research. While not specifically designed for UX, these tools can be effectively used alongside specialized user research analysis tools to provide a comprehensive analysis of quantitative data. The choice between these tools often depends on the complexity of the analysis required, the size of the dataset, and the researcher's familiarity with the software. Many UX professionals use a combination of both, leveraging Excel for initial data exploration and basic analysis, and SPSS for more in-depth statistical procedures.
Why is UX research important? It's simple—UX research bridges the gap between assumptions and reality. It helps companies create products that users actually want and need, rather than what companies think users want. Good UX research leads to better designs, happier users, and ultimately, business success.


.svg)


